6.1 Why drainage analysis is needed
Permanent deformation, and many other forms of damage, hardly ever exist if excess water is not present in the road structures and sub grade soils. Results from the ROADEX project clearly show that keeping the road drainage system in a good condition is the most profitable maintenance action possible on low volume roads
View:
Roadex II “Drainage on Low Traffic Volume Roads” and ROADEX III “Developing Drainage Guidelines for Maintenance Contracts”.
And for this process an effective drainage monitoring system is needed. A comprehensive drainage evaluation should preferably be carried out at the end of each maintenance contract period, or at a maximum of 6-8 year intervals. During the evaluation the problematic drainage sections should be identified and the need for improvement actions defined. After these problem drainage sections have been identified their condition should be checked every year. The results of the drainage analysis should then be saved into a database so the drainage information will remain available for future use.
A good drainage monitoring and improvement design strategy can be divided into three phases:
Phase 1. mapping the road sections suffering from inadequate drainage
Phase 2. making a basic diagnosis of the drainage problem sites
Phase 3. defining solutions for the problem sites
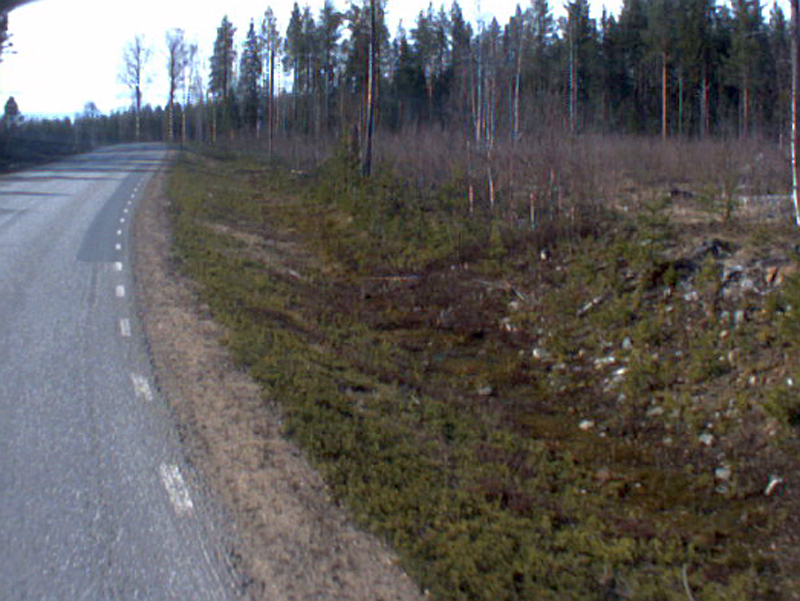
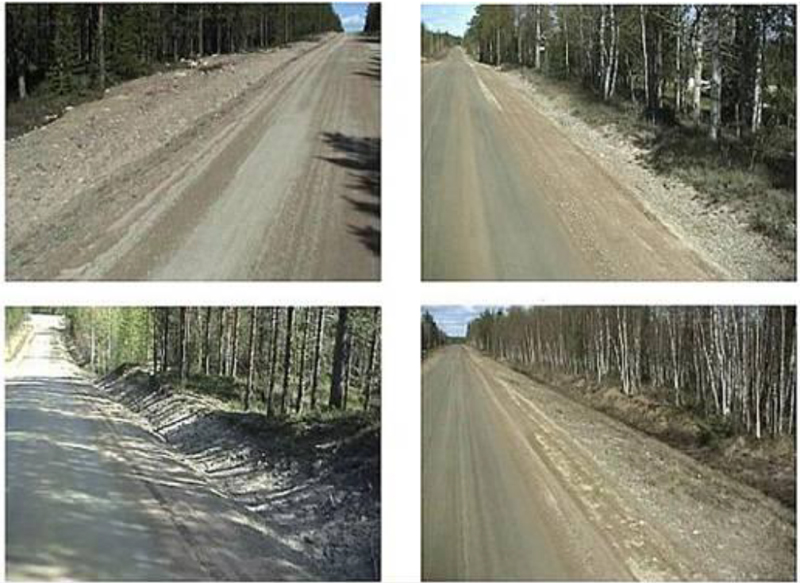
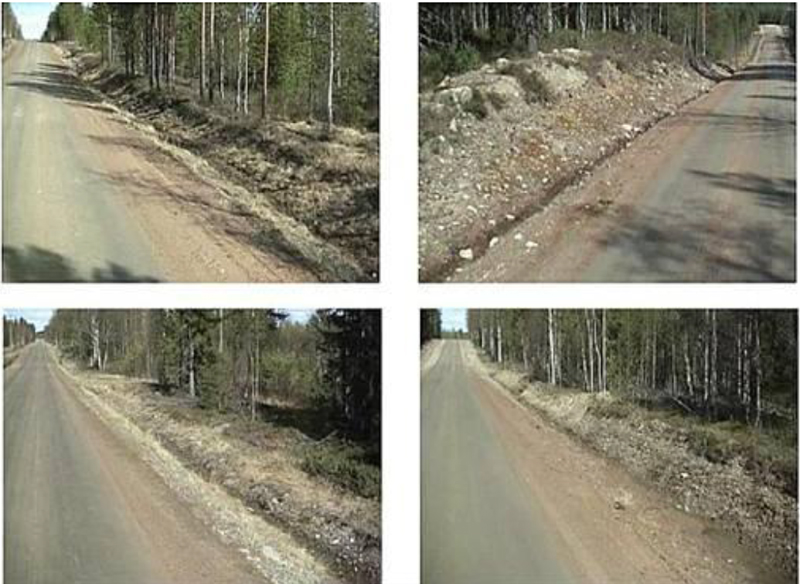
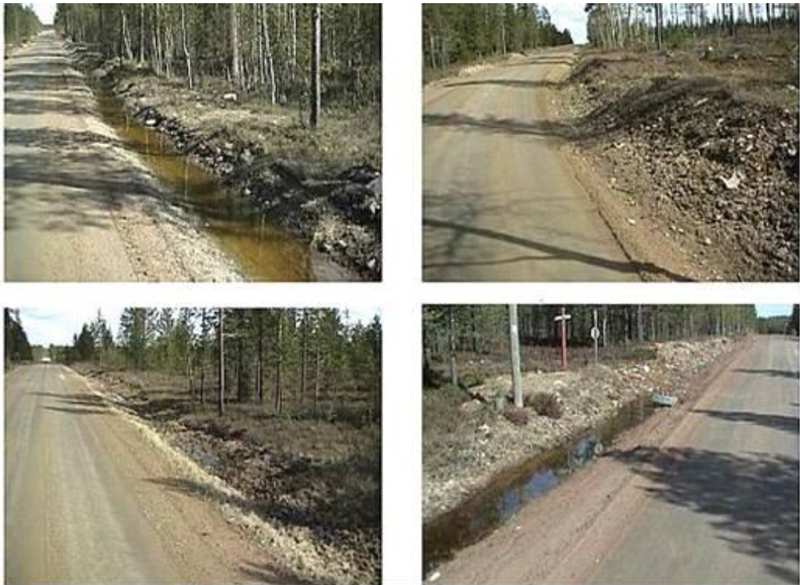
Visual inspection is still the most common monitoring tool for drainage condition, in spite of it being subjective. Visual inspections of ditches and culverts supplemented by video material, interviews of road owners and maintenance crews, rutting and roughing history and GPR data provide a good basis for drainage monitoring. The laser scanner technique has recently become a new tool that can be recommended for drainage inspection. Thermal cameras are also being increasingly used nowadays.

6.2 Components of drainage analysis
6.2.1 General
The ROADEX project recommends that three issues should be classified in a drainage classification, mainly because they can be carried out from a moving car taking videos or still photographs at the same time. The recommended classification fields are:
– Road cross-profile
– Drainage class
– Outlet ditches

6.2.2 Cross-profile
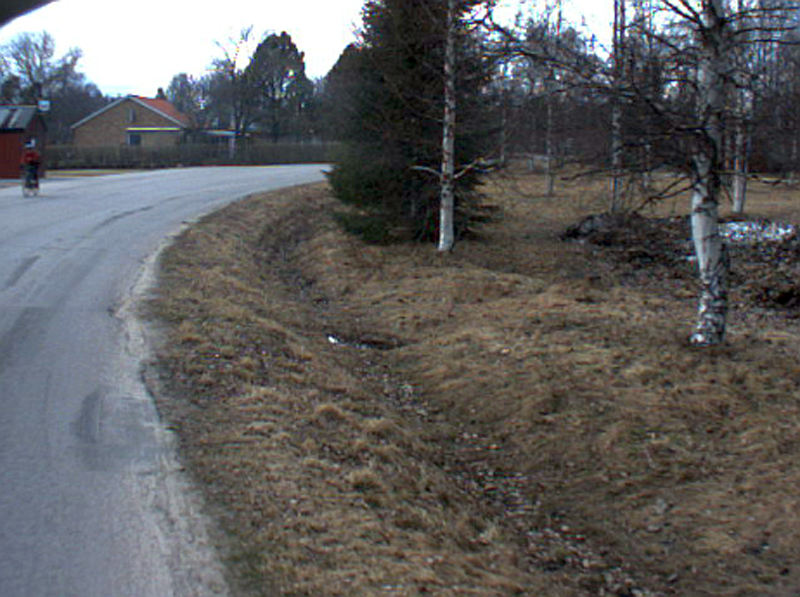
Road cross-profile should be classified to determine if the drainage problems are related to a specific road section, eg if the greatest drainage problems are located in road cuts. The position of the road in comparison to the surrounding terrain (ie the road section “cross-profile”) can have a substantial affect on the selection of the drainage rehabilitation method. For this reason the cross-profile of the road should be classified during the first drainage survey, as well as for the selection of the drainage solution. The cross profile types used in the ROADEX drainage analysis are described in the following.
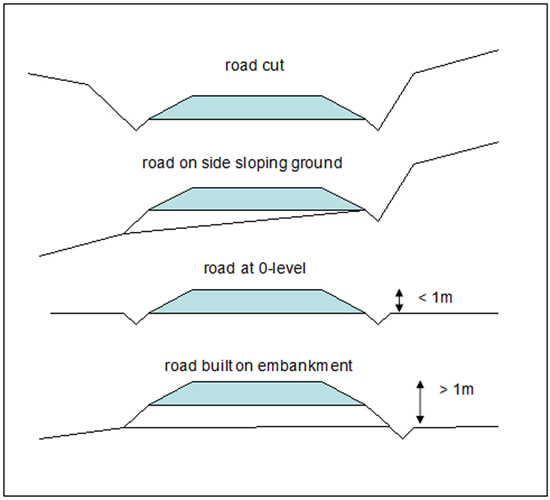


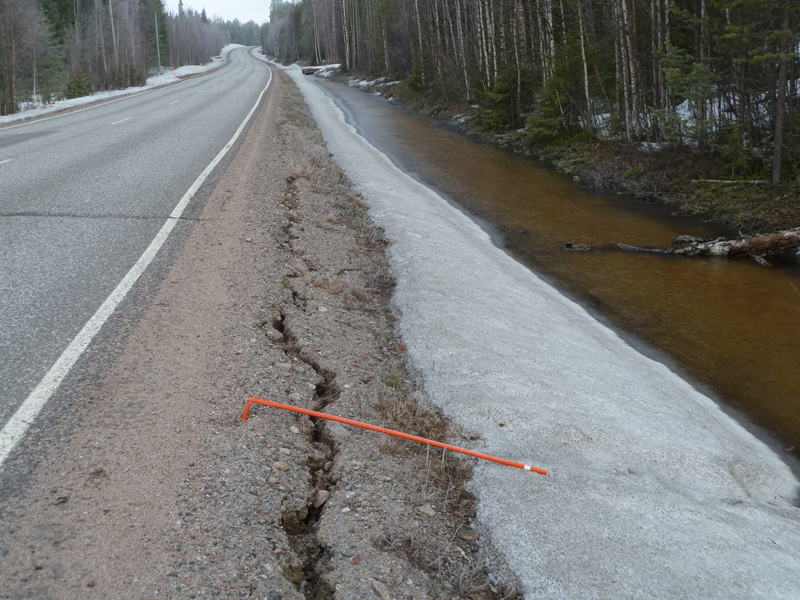
The road is in a cut, when the foundation of the road structure is below the level of surrounding terrain. There are usually side ditches on both side of the road.

The road is on side sloping ground when the surrounding ground on one side of the road is below the road structure foundation and above the road structure foundation on the other side. Whenever the road is in a side sloping ground the ground water tries to flow under or through the road structures.
The road is on zero-level when the foundation of the road structure is more or less on a same level as the surrounding ground. There are usually ditches on both side of the road.
The road is on an embankment, when the pavement structure surface is clearly (> 1m) above the surrounding ground. Depending on the road section, there can be ditch on both sides or only on one side of the road.

6.2.3 Drainage classes
For paved roads, drainage condition can be classified into three categories: Class 1 for good and properly working drainage, Class 2 for fair drainage conditions and Class 3 for poor drainage conditions. When making the classification it is also important to record the reasons for the classification, such as a grass verge on the pavement edge, or an unstable side slope, etc. ROADEX project has created a special classification for grass verges on roads: Class 0 for no grass verges, Class1 for grass verges that do not cause problems to the road drainage and Class 2 for grass verges blocking water flow away from the pavement and causing pavement failures. In Nordic countries the verge classification only has two categories as the verges are “unwanted” soil and grass barriers beside the pavement that have arisen due to poor maintenance. On Ireland and Scotland the verges are designed “man-made structures” that continue to be built in some areas. Class 1 verges in Nordic countries cover those road sections where there is no verge and water can flow freely from road surface. Class 2 (verges exist) cover all road sections with verges. The height of verges can vary from low verges, which only have a minor effect on drainage, to high ones which clearly prevent surface water flowing away from road surface.

For gravel roads, drainage condition can be classified into three categories: Class 1 for good and properly working drainage, Class 2 for fair drainage conditions and Class 3 poor drainage condition, or where there is no drainage structures on the road and there is clear need for them.


The World Bank HDM4 system recommends that a five class drainage system classification should be used. ROADEX however recommends that three classes should be used as this has proven to work well in Scandinavia.
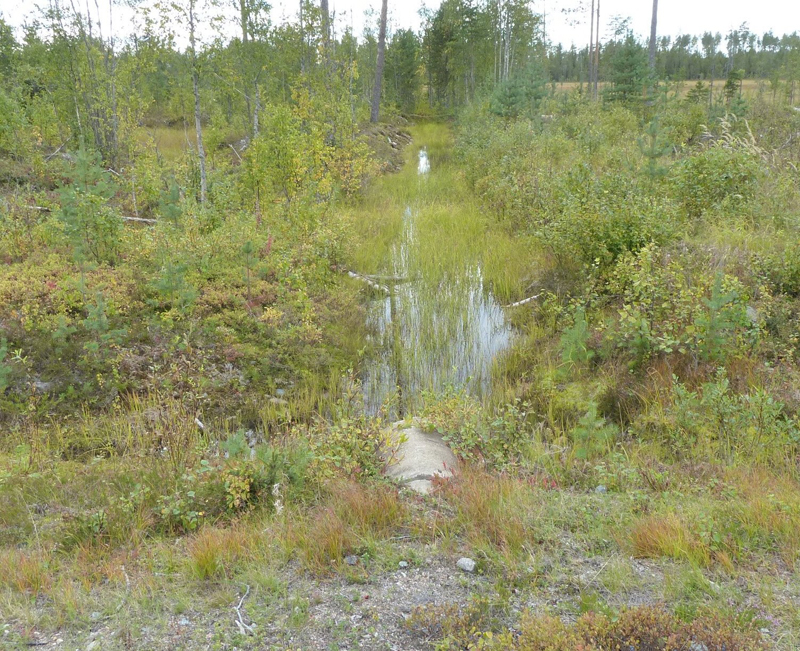
6.2.4 Outlet ditches
The third parameter in a drainage classification is the check of the condition of the outlet ditches. An outlet ditch either works or it does not work, so this classification is a simple 0/1 system where the outlet ditch condition is either working, or clogged. Checking the outlet ditch condition is difficult from a moving car and ROADEX recommends that a third video camera is used in drainage analyses pointed 90° angle from the road.


6.2.5 Culverts
In addition to the drainage survey made from a moving car, the condition of culverts should also be checked, at the very least before any major structural improvement and before a new maintenance contract procurement process. Surveying the condition of a culver takes time and money, and for this reason it is not done automatically in a drainage analysis. A culvert analysis should be made visually and any faults documented with a camera. The coordinates of the culverts should be recorded. The location of the culverts can be mapped beforehand from a 400 MHz GPR survey.

The condition of culverts can be checked in many ways. The following check list is from the Swedish guidelines and has proven to work well in culvert condition analysis:
- Type (main / access road culvert)material (concrete, plastic, steel etc.)
- Size (inner diameter)
- Age (How much lifetime is left?)
- Capacity (Is the capacity adequate? Is the culvert too small?)
- Foundation (Are there settlements, ie is the culvert straight)
- Frost safety (Do the culvert ends freeze?)
- Erosion (Has water caused erosion problems? Are the slopes stable beside the culvert?)
- Elevation (Is the culvert too high?)
- Bearing capacity (Are there deformations, damages, holes due to a lack of bearing capacity?)
- Water (Is anything to note regarding flow rate, speed, chemical composition?)
- Location (Is the culvert in right place, in right altitude and is the length right?)
- Outlet ditch (Does it exit, if needed?)
- Filling height (Are there sufficient road structures above the culvert?)
- Environment (Are there any comments on the speed of water, inclination and bottom of culvert? Can water flow freely? Are there any blockages?
- Traffic safety (Can vehicles crash into the ends of culvert?)
Reference:
Bakgrundsdokument till handledning för identifiering av behov av avvattningsåtgärder
The culverts can be classified into three classes.
Class 1: Culvert operates well; no need for maintenance
• Water flows freely, no adverse remarks
Class 2: Fair operation; culvert need to be cleaned / flushed out
• 25% or more of diameter of culvert is full of trash
• Culvert has stones or branches preventing the water flow through the culvert
• Vegetation at the ends of culvert prevents the flow of water

Class 3: Poorly working culvert, need for further investigation and some maintenance operations
• Cracks in the culvert, culvert is broken
• Ends of the culvert have risen up
• Stability problems
• There is need for a culvert, but the culvert is missing
6.3 Drainage analysis techniques
Timing is very important for a drainage evaluation. The best time to carry out a drainage analysis is in the spring immediately after the snow has melted and before the vegetation starts to cover the bottom of the ditches. At this time the deficiencies of the drainage system can be clearly seen due to amount of water in the ditches. The data collection can be started immediately when the snow has melted from the ditches and shady road sections, and the analysis should be finished before the vegetation starts to obscure the bottom of the ditch. Drainage surveys can also be carried out in the fall. Data collection can be started when leaves have fallen from the trees and the work should be finished before the snow starts to cover the ground. The autumn is not quite so good as spring for drainage analysis however due to the light conditions and vegetation growth.

Comparative drainage analyses were carried out in spring and in autumn on the same road network in the ROADEX drainage tests in Umeå Södra area in Sweden. According to the results the greatest part, (almost 70%), of the ditches were classified to be the same class both in spring and in autumn. Only a marginal proportion of the ditches (0.5%) were classified as significantly better or in worse condition in the spring. 18.1% of ditches were slightly better in spring and 11,6% were slightly worse.

There were several reasons for the differences. Mainly the reasons were the presence of a permeable subgrade or water in the ditch. The same project carried out comparative observations of outlet ditches in spring and autumn. Only 45% of outlet ditches were observed both in the spring and in the autumn.

The View ROADEX report: “Summary of Drainage Analysis in the Umeå Area, Sweden, Seasonal Tests and Tools for Outlet Ditch Inventory”
6.3.1 Survey equipment and data collection
6.3.1.1 General
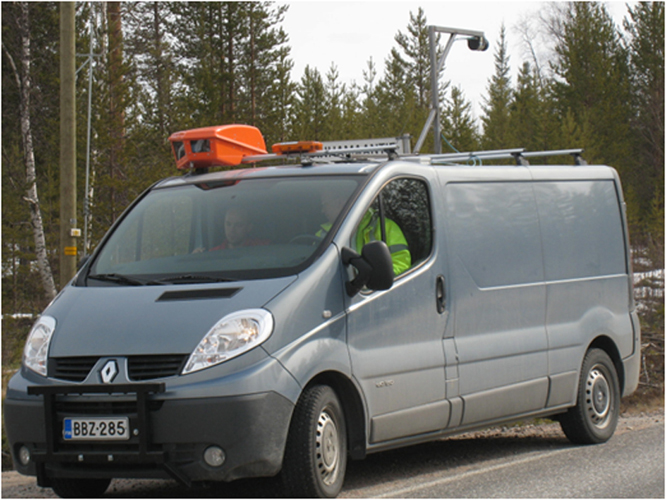
The ROADEX project recommends that the survey equipment for a drainage analysis should consist of a survey vehicle, sufficiently high enough for good visibility, equipped with a distance measurement instrument (DMI), 2-3 digital video cameras or still photo cameras, GPS equipment and a laptop computer, with all the necessary data collection software. The survey vehicle should be equipped with all necessary safety equipment. Two persons, a driver and surveyor, will be required for the survey.

6.3.1.2 Video and still cameras
Earlier ROADEX tests and other drainage analysis works have shown that a visual drainage assessment from a moving vehicle, without any documentation of drainage condition, was not sufficiently reliable or repeatable. In addition the surveyed current condition of ditches and pavement could not be reviewed later, if there was any dispute. For these reasons it is recommended that the drainage analysis hardware should have at least two digital video, or still cameras, mounted on the top of survey vehicle at a minimum height of 2 m above the road. One camera should record the road shoulder and adjacent ditch condition, and the other should record the condition of the pavement. The data collection software should have an option to store audio comments during the survey.
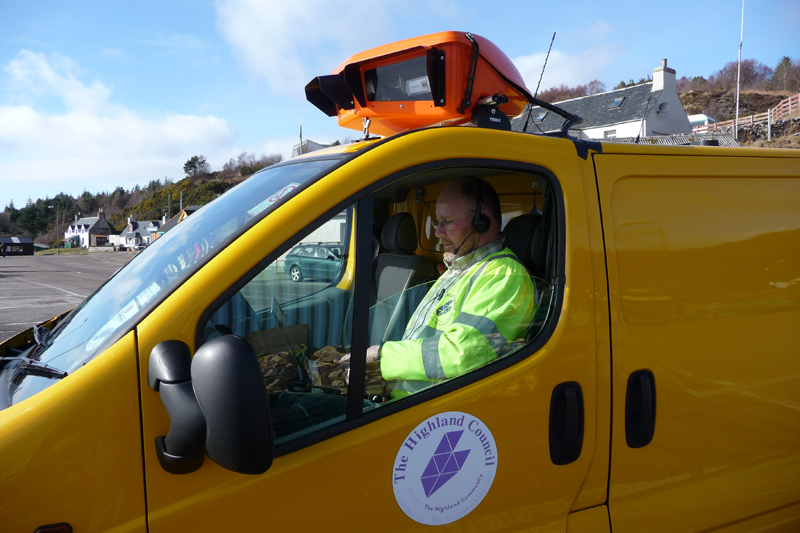
Ideally, a drainage survey should be carried out with three cameras, where the third camera is fixed at right angles to the vehicle direction to be able to record the condition of any outlet ditches that the vehicle passes. The output from this camera can be used classify the condition of outlet ditches. The quality of video and/or still cameras should be sufficiently high enough to record the information required with a resolution of at least 640×480 pixels. All cameras should be focused at a distance of 10 to 15 m from the survey vehicle and the shutter speed should be high enough to allow a sharp picture.
6.3.1.3 Other equipment that can be used in drainage analysis
Thermal camera
A thermal camera, also called an infrared-camera, measures the radiation emitted from environment in the infrared-frequency range. The camera forms a video image from the radiation similar to a traditional video. “Normal” cameras which are based on light, usually measure the wavelenght of visible light 450-750 nm. A thermal camera in comparison can measure wavelenghts as high as 14 000 nm.

Thermal cameras can be divided into different classes according to the radiation detector. There are two main classes; cameras in which the infrared-detector is cooled by liquid nitrogen (BST-detector) and the uncooled infrared-detector cameras (microbolometer-detector).
The prices of thermal cameras have been lately quite high, because of the new technology and small production series. At this moment the prices of thermal cameras are over 5,000 €. Prices of high-quality cameras can be even more than 30,000€. These high-quality cameras can be useful in carrying out pavement distress inventories.
In a drainage analysis the thermal camera should be set on the roof of vehicle in the same fashion as a digital camera. “Normal” digital video and GPS-coordinates should be taken at the same time as the thermal measurements are recorded. The thermal camera should ideally be directed to ditch whilst retaining the road partly in the view. The speed of vehicle should be restricted to 30km/h during the survey.
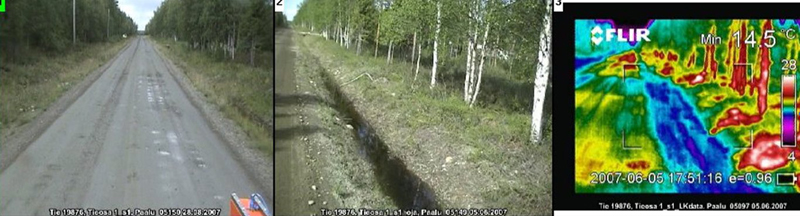
The best time to carry out a thermal camera survey for a drainage analysis is in May or in the beginning of June. The best time of day to make the survey is in the small hours or early in the morning. Thermal radiation from the sun has no effect on the results at these times. The thermal radiation from the sun can greatly warm the ground surface.

The results from thermal camera can be divided into five classes according to temperature of the bottom of the ditch. The classes of temperature are:
– Class 1: Very high relative temperature
– Class 2: High relative temperature
– Class 3: Average temperature
– Class 4: Low relative temperature
– Class 5: Very low relative temperature

Laser scanners
The popularity of laser scanners in road survey has increased greatly over the last years and it is inevitable that the technique will become a standard tool for a variety of tasks in road condition management. Laser scanning is a method where the distance measurement is calculated from the travel time of a laser beam from the laser scanner to the target and back. When the laser beam angle is known, and beams are sent out in different directions from a moving vehicle with known position, it is possible to make a three dimensional (3D) surface image, a “point cloud”, of the road and its surroundings. In the point cloud, with millions of points, every point has an x, y and z coordinate and a number of reflection or emission characteristics.


A laser scanner is composed of three parts: the laser canon, a scanner and a detector. The laser canon produces the laser beam, the scanner circulates the laser beam, and the detector measures the reflected signal and defines the distance to the target. The distance measurement is based on the travel time of light, or phase shift, or a combination of both.
The quality and price of mobile laser scanner survey systems vary but they can be roughly classified into two categories a) highly effective high accuracy systems, also called “LIDAR” and b) cheaper “everyman’s” laser scanner systems that have reduced distance measurement capability and accuracy.


Laser scanner results can be used in several different ways in low volume road surveys. A road cross-section profile can provide good information on the shape of ruts, and whether there are verges preventing water from flowing from the pavement. A map showing the surface levels in colour codes can be prepared to identify the places with debris filled ditches and clogged culverts. Changes in the width of the road can also be easily seen from these maps. When other road survey data is combined with laser scanner data it can provide excellent basic information for determining if poor drainage is causing permanent deformation or frost problems.


6.3.1.4 Posioting equipment
Drainage surveys should be so designed to ensure that all videos, still photos and the results of drainage analysis classification data can be labeled and linked to GPS coordinates and to the road data base address. To ensure this, all positioning should be made using differential GPS equipment or other GPS equipment with DGPS accuracy. It is also recommended that a DMI is used in addition to GPS during the data collection. GPS usefully provides a z-coordinate and, even though its absolute height is not very accurate, the information can be used in drainage analysis for finding the highest and lowest points in the road.

6.3.1.5 Survey personnel
Survey personnel, especially the surveyor, should be sufficiently trained so that she/he can reliably identify the condition classes set out in the drainage analysis guidelines. The driver of the survey vehicle should similarly be acquainted with the classification if it is intended that he/she is should take part in the inventory. All personnel should be trained in how to conduct road surveys and be aware of all road safety issues.

All survey personnel should be given one day training before the survey season, where all of the issues related to the drainage analysis can be practiced. A field trip should be included during the training day where the survey personnel can carry out a drainage analysis on a selected road section. Later, the results from different surveyors should be compared with each other in the office.
6.3.2 Data collection
Drainage analyses should be carried out on one road section at a time, and both sides of the road should be analysed separately. Exceptionally, in those roads where the width is less than 5.5m, the inventory may be made in a single direction.
During the data collection the speed of the survey vehicle should be restricted to between 20-30 km/h and the vehicle should drive close to the pavement edge to give the cameras an unrestricted view to the ditch and side slope. The surveyor should record the initial drainage condition class of the side ditch and outlet directly into the data collection laptop using the keyboard, and at the same time record any comments regarding the survey through the audio file of the digital video. Typically these comments should include:
• the classification of the drainage condition;
• the classification of the road profile;
• any corrections to mistyping the inventory which need to be corrected later;
• any observations on grass verges or pavement distresses restricting the water flow to the ditch;
• any notes on soil slippage from the inner and outer slopes to the bottom of the ditch, blocking the water flow.
These types of audio comments have been proven to be very valuable in ensuring the quality and repeatability of the inventory.
6.3.3 Saving and securing data
All data collected from the field should be saved daily into the inventory laptop and into an external hard disc. In addition the analysis work in the office should be backed up frequently.Videos can be converted into still-images in order to save disc space prior to delivering the results of the drainage analysis to the road owner.
6.4 Analyzing the results from the drainage analysis
6.4.1 General
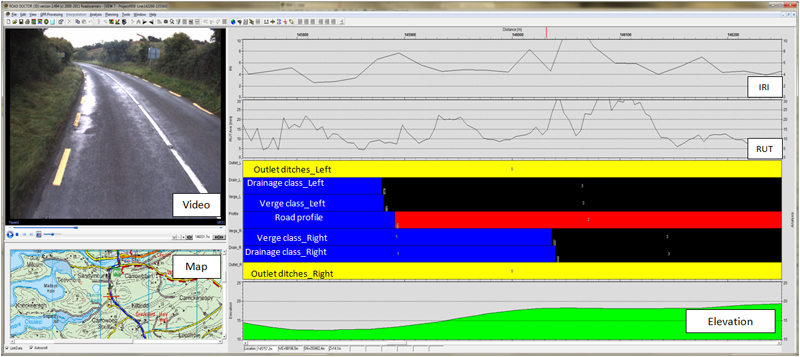
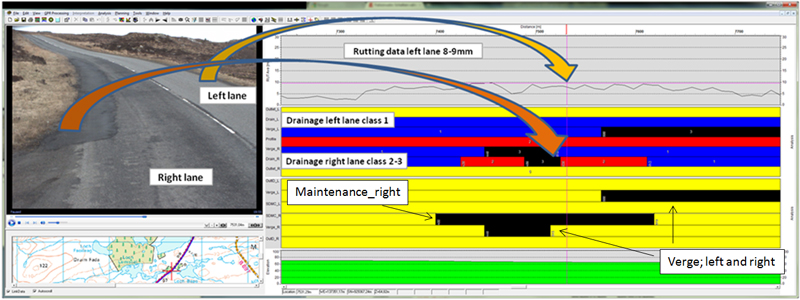
The first step in the process is to link all of the data collected in the field to a project established for each road section. This can be done, for example, with Road Doctor Designer ® or similar software, where the initial drainage analysis results, cross profile data, digital videos and still images can be linked to spatial data. Any road profilometer data (rutting and roughness) should also be linked to the project, preferably the last five years of historical data. This data can usually be abstracted from the road owner’s database or collected up-to-date on site. Once this has been done the main drainage analysis can be carried out by a number of techniques, depending on the type of coverage of the profilometer data. Either 10 metres or 20 metres average profilometer data should be used. Average results from 100 metres are too long for a reliable drainage analysis. The correlation between pavement distresses and drainage condition should also be noted at this time.

For gravel roads, the drainage analysis results should be compared with any spring thaw weakening inventory results, and any distresses seen in right-of-way road videos and still-images. A very good parameter to compare, if available, is the BCI-value, calculated from the falling weight deflectometer (FWD).


Comparison between frost heave and drainage can also be done at this time, for example by using IRI winter measurement results, or antenna elevation data from a Ground Penetrating Radar survey. The comparison can also be carried out using the new Laser Scanning technique. This is an excellent method of locating problem sections on roads.
6.4.2 Drainage classification of paved roads
The ROADEX drainage classification for paved roads is described in the following:
Class 1: Good Drainage Condition
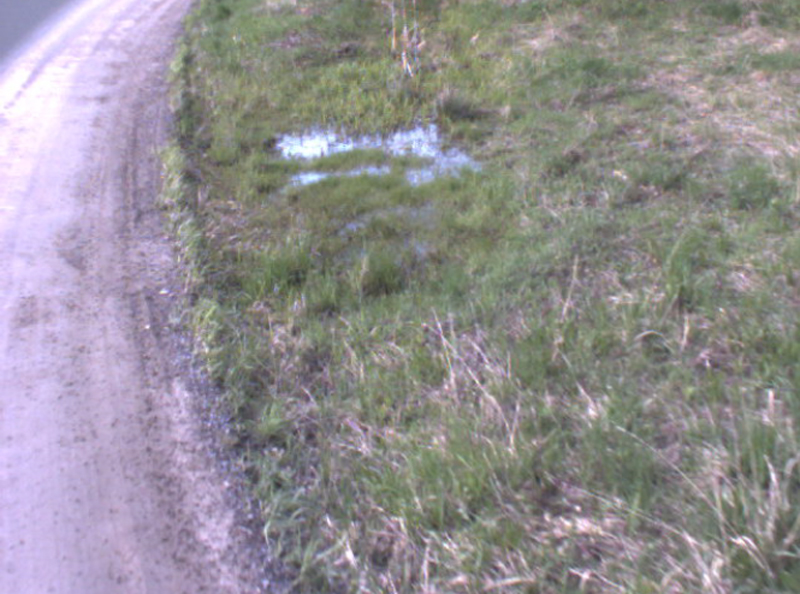
Description: Faultless drainage. The road cross section shape has preserved its form well and water flow from the pavement to the ditch has no obstacles. Unrestricted water flow in ditches.

Class 2: Adequate Drainage Condition
Description: Small changes in the road cross section shape can appear. The road shoulder has small verges or vegetation that prevents good water flow to the ditch. Vegetation in the ditches restrains water flow and causes dams. A small amount of soil flows from road slopes into the ditches and raises the bottom of the ditch, slows the water flow and raises the groundwater table.

Class 3: Poor Drainage Condition
Description: Deformations and damages are evident in the road cross section. The road shoulder can have a high verge and/or dense vegetation that causes ponding on the traffic lane or on the shoulder. Vegetation in the ditch restrains water flow and causes dams in the ditch. Unstable soil flows from the ditch slopes into the ditches and blocks the water flow. Blocked culvert or outlet ditch prevents the water flow in the ditch. The road does not have drainage system at all.

When carrying out a drainage analysis for a paved road, the correlation between the deterioration of the road and the drainage condition should be investigated. This can be done by several methods:
A. When Road Profilometer data is available from several past years In the first method, the average annual growth in rut depth is calculated from the historical data using a linear regression model. This however requires that the profilometer data is available from several years. Where the road has been recently repaved without substantially changing its character, (i.e. a structural rehabilitation), older data collected prior to the paving project can also be used.

A rate of rut increase can be considered to be normal, if the growth in rutting is less than 0.8-1.0 mm/year for traffic (AADT) < 5000 vehicles per day, and <1.4 mm/year for traffic flows greater than 5000 vehicles per day. The rate of rut increase can be considered to be high, and extremely problematic, if it is more than 2mm per year. It is difficult to define similar growth rates for IRI values for good and poor road conditions and as a result mapping of IRI growth rate is not usually needed.

B. When profilometer data is available only from one year If there is only one year of profilometer data available from the road database together with knowledge of the last overlay year a second option can be used. For this, the rutting speed is calculated with a linear model, where the line is defined by two known points: the initial rutting of the paving year and the latest rutting data from the profilometer. For the paving year an initial rutting of 2 mm can be used.

C. Average rutting and IRI-data in different drainage condition class In addition to what has been mentioned before, average rutting and IRI-values can be calculated separately for each road section and each drainage condition class based on the most recent data. Since the drainage condition class has already been analyzed for both road sides separately, the worse condition class should be used for the statistical calculations of IRI and rutting. These values can then be compared to the drainage Class 1 values. If, based on this calculation, the average rutting values for drainage Classes 2 and 3 are more than 5% higher than drainage Class 1 values, it can be assumed that poor drainage is affecting the speed of deterioration. This information can be later used when selecting the special drainage maintenance sections.


The life-time factor of the pavement can also be calculated in the statistical analysis. The “life-time factor” describes how poor drainage can affect the life-time of the pavement. The life-time factor is defined by calculating the rutting of the poorest 10% sections, and possibly average roughness, and comparing these results with the drainage condition Class 1 average rut depth. If there are more than 10% road sections with drainage condition Class 3, the ratio to be used is the ratio between third and first class roads average rut depth. In cases, when there is less than 10% of drainage condition Class 3, the life-time factor is calculated as a proportion of Class 3 and Class 2 roads.

6.4.3 Drainage classification of gravel roads
The ROADEX description for drainage classification on gravel roads or forest roads is described in the following:
Class 1: Good Drainage Condition
Description: Faultless drainage. The road cross section shape has preserved its form well and water flows from the pavement to the ditch with no obstacles. Unrestricted water flow in ditches.
Class 2: Adequate Drainage Condition
Description: Small changes in the road cross section shape can appear. The road shoulder has small verges or vegetation that prevents good water flow to the ditch. Vegetation in the ditch restrains water flow and causes dams. Small amount of soil flows from the road slopes into the ditches and raises the bottom of the ditch, slows the water flow and raises the groundwater.
Class 3: Poor Drainage Condition
Description: Deformations and damages are evident in the road cross section. The road shoulder can have a high verge and/or dense vegetation that cause ponding on the traffic lane or on the shoulder. Vegetation in the ditch restrains water flow and causes dams in the ditch. Unstable soil flows from ditch slopes into ditches and blocks the water flow. Blocked culvert or outlet ditch prevents the water flow in the ditch. The road does not have drainage system at all.
The most important thing when planning a drainage analysis for a gravel road is to define those sections that have a correlation between frost heave damages and drainage condition, in other words to find out where poor drainage is the main reason for the frost heave damage. This can be done by using map analysis and design software that displays the location and the history of spring thaw weakening problems, drainage classes and video or still photos from the road. If there is no detailed documented data of frost heave damages, the potential frost heave locations may be located from a survey video taken during the spring thaw. A thermal camera or laser scanner frost heave measurements may also be used to identify frost heave locations.

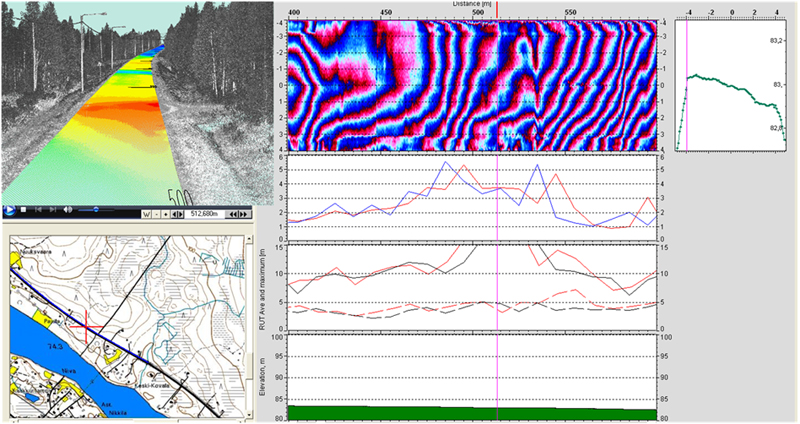
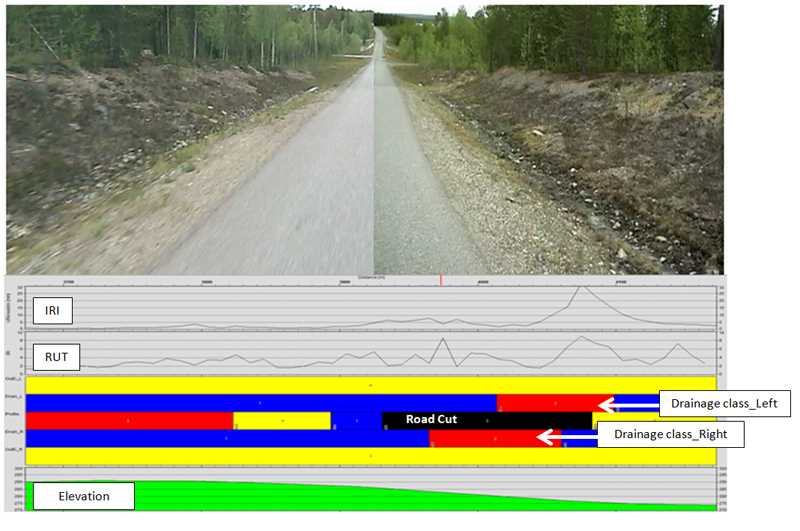
The top row shows thee results from the drainage analysis and below that frost heave history 2001-2006. Below that are the deflection bowls measured with FWD. The bottom row shows IRI results from winter. These can be used to locate settlements caused by the frost heave.
When defining the cross profile on gravel roads special attention should be paid to sections located in side sloping ground and the condition of the side ditch on the higher side of the road. Frost heave damage and slope slides are usually concentrated in these types of sections.
The locations of all soil flows or sliding soil in the inner and outer slopes should be noted and recorded in the drainage analysis results. Dumping of excavated materials from ditch cleaning should not be permitted in these areas.

6.4.4 Outlet ditches
When presenting the results of a drainage analysis it is recommended that the location of the outlet ditches, which need to be rehabilitated, should be shown on a map and a table. The table should show the road address, the ditch location (left or right) and the chainage.


Problems can arise however when trying to survey, identify and classify the condition of outlet ditches from a moving vehicle with forward facing cameras, and as a result this method is not always successful. It is therefore recommended when carrying out the drainage analysis in the office that the locations of outlet ditches are confirmed by using GPS-data Z-coordinates collected during the survey. Usually there is an outlet ditch in every sag in the road alignment. If still photographic images are being collected, the survey vehicle should pause at each outlet ditch for a condition evaluation.

Finally, as recommended earlier in this package, a third camera pointing at 90º to the direction of travel of the survey vehicle will allow the condition of the ditch to be later evaluated from the video or still images.
6.5 Locating problem areas
The selection of special drainage maintenance sections for drainage plans and/or drainage maintenance contracts is usually carried out using specialized software. In this work an integrated view is created where all the data can be shown at the same time: i.e. video or still images of the road, a map, rutting and IRI historical data, annual increase in rutting (if it has been possible to calculate), road vertical profile (Z-coordinates) and the results of the drainage analysis.
The status of “special drainage maintenance class” should be given to those road sections of drainage condition Class 2 or 3 and the bullet points below. (Note: when carrying out the sectioning and drainage analysis, the poorer drainage condition class side of the road always defines the average condition of the drainage):
Gravel road sections that have a drainage condition Class 2 or 3, and/or differential frost heave problems, on at least one side of the road should be selected for special drainage maintenance class sections. Additionally, special drainage maintenance class sections should be considered for the following circumstances:
The upper side ditch in a road that is located in side sloping and wet ground, and the subgrade soil is moist moraine or silt.


A road located in a road cut and the soil is either moraine and/or silt.
Where the subgrade is wet silt and the shape of the road has been broadened and material from the inner or outer slopes has flowed to the side ditches.

When FWD BCI-values are more than 80 (excluding locations in peat).
Special drainage maintenance sections should be homogenous, continuous sections, and end at identifiable locations, such as an outlet ditch. Special drainage maintenance sections should be defined independently for both sides of the road. When using a computer to select the start and end points of a drainage rehabilitation, videos or short interval still images can have an important role. With them it is possible to locate drainage rehabilitation sections into logical lengths, where the section can always end in a functional outlet ditch or similar structure, where water can escape freely from the road area.
6.6 Reporting results of drainage analysis
After completing the drainage analysis and identifying any special drainage maintenance sections GIS-maps can be created for each road section. These maps should show the locations of those sections of road where poor drainage is affecting the road structures’ ability to resist permanent deformation and therefore locations of rutting and frost heave damages. A typical results map should show the road centerline, the road cross-profile, the condition class of the side and outlet ditches on both sides of the road, the average annual growth in rutting (or latest rut depth), and the selected drainage rehabilitation and/or special drainage maintenance locations.

In addition to maps, all of the results of the drainage analysis should be saved digitally, so that all analyses and plans can be retrieved from the database at a later date. This means that the correct coordinates must be used at all stages of the analysis and reporting. It is not acceptable to digitize road centerlines from maps using pixel coordinates. The final results of the analysis should be stored so that they can be viewed at a later date in the office, or even in a vehicle, together with still images, with different viewing and / or design software.
